New vehicle sales January 2026: One in seven cars now has a plug
Author: Ben Selwyn | Posted On: 19 Feb 2026
New Vehicle Sales January 2026: Australian new vehicle sales totalled 87,753 units in January 2026, just 128 more than the same month last year. On the surface, a market in steady state. But the headline number is the least revealing figure this month.
In January 2025, roughly one in fifteen new vehicles sold had a plug. In January 2026, that ratio is closer to one in seven. Petrol sales fell 15%, Toyota posted its weakest January in years, and the first-ever NVES compliance data landed on 18 February, giving the industry its inaugural report card on emissions performance.
Dig into what Australians are buying, and what the regulator now knows about how brands are tracking, and January reveals a market in the middle of a structural powertrain transition that is accelerating faster than most forecasts anticipated.
Top takeaways
- Flat but far from static: The market delivered 87,753 units (+0.1% YoY), but the composition tells a different story entirely. Petrol fell 15% while BEV surged 93% and PHEV climbed 170%.
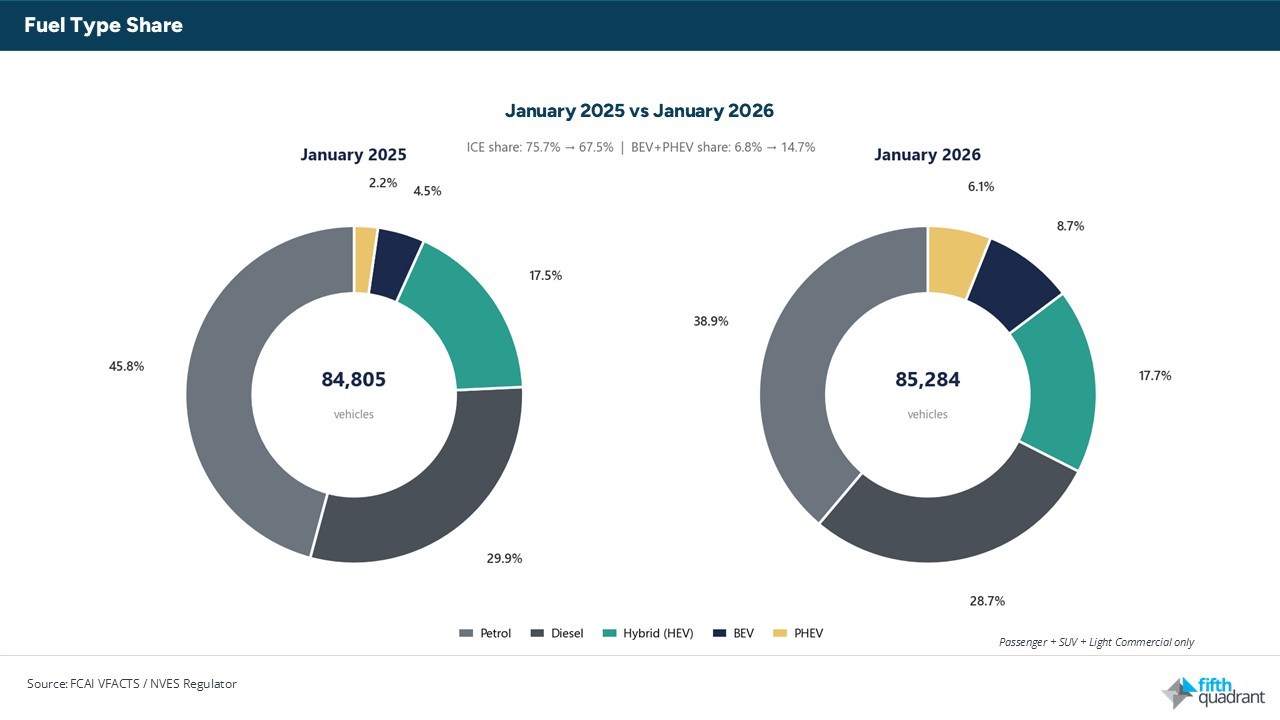
- One in seven now has a plug: BEV and PHEV combined accounted for 14.3% of total sales, up from 6.6% a year ago, more than doubling in twelve months. Add non-plug hybrids and the broader electrified share reaches 32.5% of passenger, SUV, and LCV volumes.
- NVES report card drops: The first-ever compliance data from the NVES Regulator shows 40 of 59 entities beat their targets across July-December 2025, generating a collective 15.9 million unit credit surplus. But targets tighten 17% in 2026, and the easy period is over.
- Rental fleet revival: The rental channel surged 47% from 3,576 to 5,258 units, with passenger rental volumes doubling. Fleet managers may be rotating stock or testing electrified options ahead of larger procurement commitments.
The first NVES report card, and what it means for the brands Australians drive
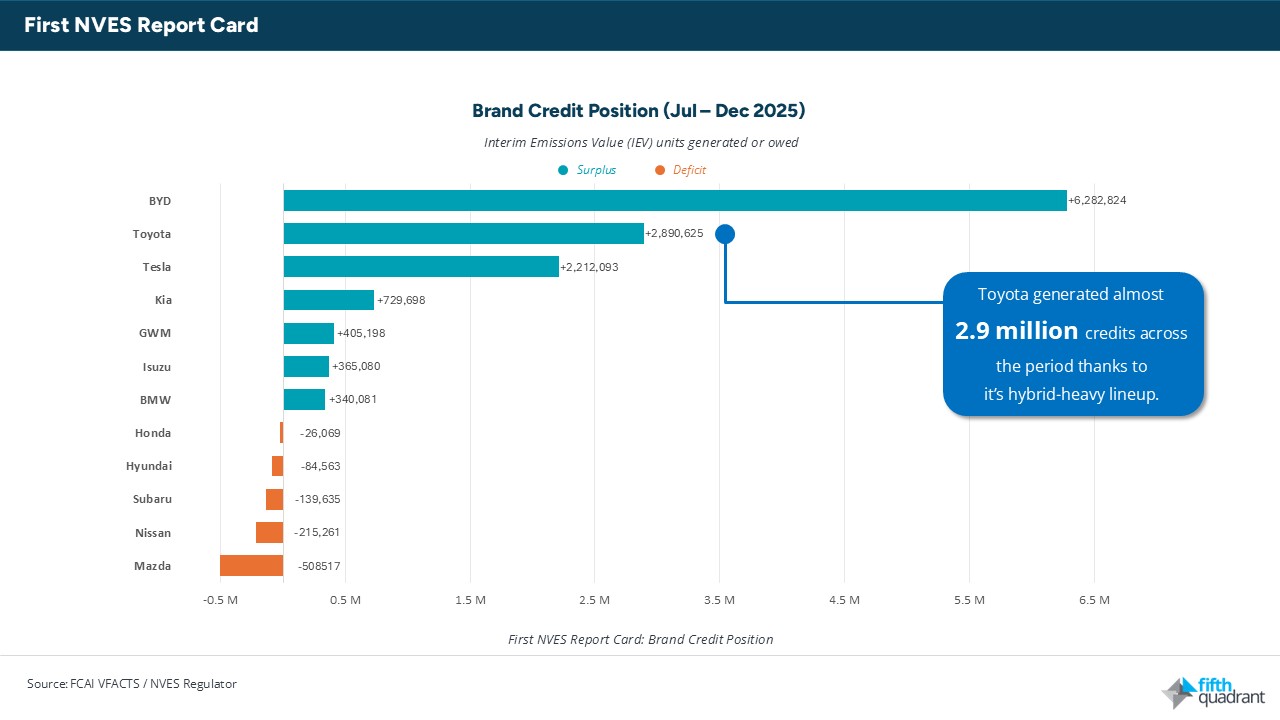
On 18 February 2026, the NVES Regulator published its first compliance dataset, covering 59 entities and 620,947 vehicles assessed between July and December 2025. The headline result: the industry collectively beat its targets, with passenger vehicles averaging 114 g/km against a 144 g/km ceiling. That aggregate comfort, however, masks a sharply divided brand landscape.
Toyota generated approximately 2.9 million credits across the period, its hybrid-heavy lineup converting years of powertrain investment into tangible regulatory advantage. Kia banked 729,698 credits despite a still heavily ICE-weighted range, Isuzu secured 365,080 credits notwithstanding its diesel-dominant LCV portfolio, and BMW added 340,081. All three benefited from either efficient model mixes or the comparatively lenient first-period targets. These brands now hold strategic flexibility: credits can be banked, traded, or used to buffer against tighter future targets.
The deficit side of the ledger tells a more uncomfortable story. Mazda recorded the largest shortfall at 508,517 credits, roughly $25 million if settled at the $50 per-unit penalty rate rather than offset through credit purchases. Nissan carried a 215,261-credit deficit (~$10.8 million), Subaru owed 139,635 (~$7 million), and Hyundai finished with an 84,563-credit liability (~$4.2 million) despite its Ioniq EV lineup. Honda rounded out the deficit brands at 26,069.
Hyundai’s position is perhaps the most instructive: the brand offers a credible EV range, yet still ended the first compliance window in the red. Offering electrified models is not the same as selling enough of them.
The cost implications are not theoretical. Nissan raised the price of the Y62 Patrol by $5,000 during 2025, explicitly citing NVES compliance as a factor, and is now down 38% in January YoY. Other brands are absorbing costs for now, but analysts have calculated potential per-vehicle uplifts of more than $3,000 on models like the Ford Ranger if compliance bills are eventually passed through.
We also need to remember that the 2025 targets were deliberately set as an on-ramp, giving manufacturers time to adjust. In 2026, targets tighten by 17%. By 2029, Type 1 vehicles must average 58 g/km, less than half the current weighted average of 114 g/km. Brands that banked credits in the opening window bought themselves a runway. Those that could not meet the introductory benchmarks face compounding pressure as each successive year demands a cleaner fleet average.
Petrol’s 15% decline and the hybrid bridge
In a market that moved sideways on total volume, petrol-powered vehicles lost nearly 5,700 sales, falling from 38,852 to 33,144 units (a 15% YoY decline). Those units did not disappear from the market. They migrated: PHEVs added 3,253 units (+170%), BEVs gained 3,577 (+93%), and HEVs held steady at 15,131. The substitution is now happening at a pace visible in a single month’s data, not just in annual trend lines.
The monthly trend over the past eighteen months tells the structural story clearly. BEV and PHEV together represented around 6% of sales in mid-2024. That share climbed through 2025, crossing 10% in July and holding above 11% for the final quarter of the year. January 2026’s 14.3% represents the highest combined plug-in share on record.
The PHEV growth merits particular attention for what it reveals about the segments driving the transition. Of the 5,165 PHEVs sold in January, 3,612 were SUVs and 1,439 were LCVs. Meanwhile, diesel held comparatively steady at -4%, and continues to dominate LCV sales with 15,436 of 17,995 units. The work vehicle transition operates on a different timeline, governed by payload requirements, charging infrastructure at job sites, and model availability rather than consumer preference alone.
At 32.5% electrified share and an annual growth rate of roughly eight percentage points, the trajectory points toward majority electrified sales within two to three years. That timeline compresses further if NVES deficit brands accelerate incentives on their electrified models to improve compliance positions, a dynamic that the first compliance data now makes far more likely.
Heavy commercial: a soft start, with questions ahead
The heavy commercial vehicle sector recorded 2,469 units in January 2026, down 12% on January 2025. Isuzu retains clear segment leadership at 535 units and a 21.7% market share. The January softness continues a theme from 2025, which finished around 10% below 2024’s record result.
The drivers are largely supply-side. Record insolvencies in the transport sector (up 173% since 2021-22) have released large volumes of late-model used trucks onto the market, displacing new-vehicle demand. A structural driver shortage (28,000+ unfilled positions, with nearly half the workforce over 55) constrains fleet expansion even among operators with freight to move. Alongside this, higher financing costs and the ADR 80/04 (Euro 6) emissions standards changeover, which disrupted manufacturer supply chains through the second half of 2025 is adding further headwinds.
looking ahead
Two narratives are competing for 2026. One is that electrification has reached a structural tipping point and the growth will compound. The other is that the overall market has reached a ceiling, with EV gains being offset by broad softness in traditional segments. February’s data will provide the next guide as to which story is winning.
What is already clear is that NVES compliance is now inseparable from commercial strategy. February will be the first full trading month in which every brand knows exactly where it stands. For deficit brands, the pressure to move electrified metal intensifies immediately. Expect pricing adjustments, enhanced incentive packages, and aggressive fleet offers from those carrying the largest shortfalls. Credit-rich brands, by contrast, hold optionality: they can price for margin, bank credits for tighter future years, or explore credit trading as a revenue line.
Toyota’s RAV4 performance deserves continued attention. If volumes normalise in February, the January collapse was supply noise. If the dip persists, it may signal a more structural model-transition gap. The rental channel surge could also be an early indicator of fleet managers cycling electrified vehicles through short-term fleets before committing to larger procurement shifts.
Fifth Quadrant publish monthly new vehicle sales updates here. For more insights on automotive market trends and consumer behaviour, explore Fifth Quadrant’s automotive market research reports or contact our team.
Data sources: FCAI VFACTS, Electric Vehicle Council Vehicle Sales Report, NVES Regulator (July-December 2025 performance period results, published February 2026). Analysis by Fifth Quadrant.
Posted in Auto & Mobility, B2B, Uncategorized